intelligent transport timetable studio (iTTS)
Your Human-Friendly Timetable Interpretation & Assurance Tool
What is iTTS?
iTTS is a flexible, modern, human interface for public transport timetables and live running data. It collects publicly available data, stores, sorts and presents it in a meaningful way, taking the "dark art" out of the interpretation of complex timetable data sets such as GTFS, TransXchange and GTFS-R.
Static Data
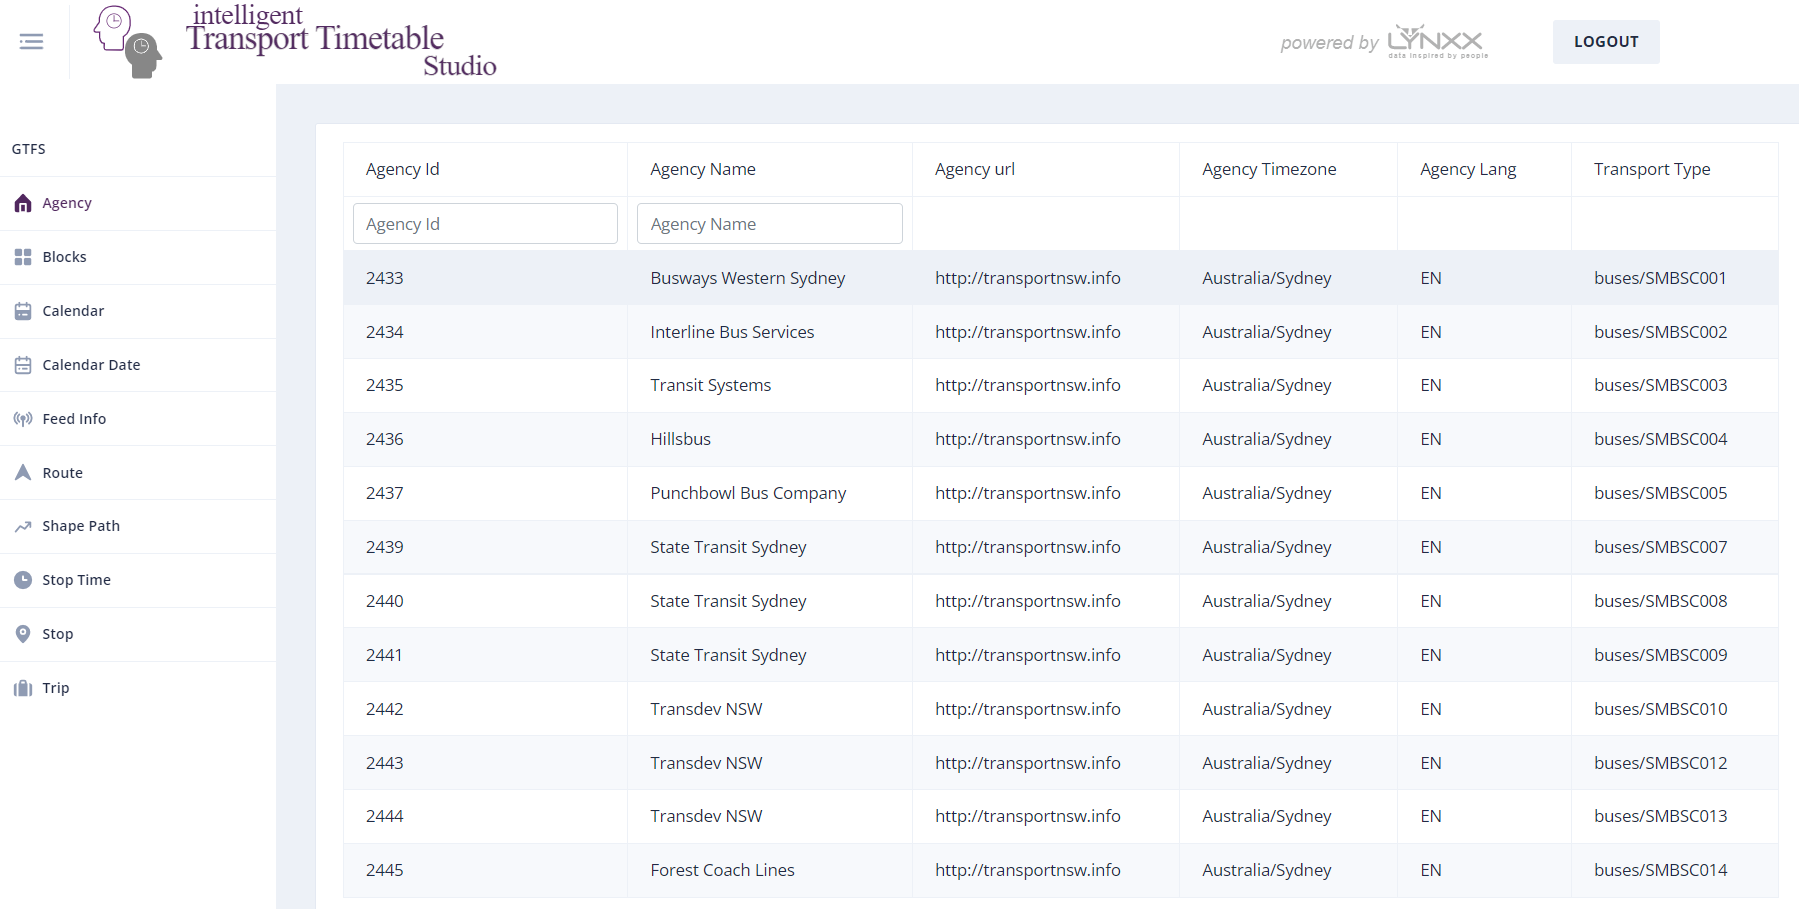
Use iTTS to intuitively filter and review static timetable data, including full GTFS and TransXchange modules. This allows you to read GTFS bundles in a simple way. Use this feature to understand a public transport network.
Real-Time
We collect real-time public transport data (e.g. GTFS-R), store it, and present it in an easy to digest way, avoiding the loss of real-time running information over time. Use this to understand how the network has been performing.
Bespoke Analytics
We have integrated a number of bespoke analytics tools, including, the backwards engineering of block diagrams, mapping on-time running (KPI performance), and out-of-tolerance reports for bundles that don't meet a formal specification.
How intelligent TT Studio Works
Working with iTTS couldn't be simpler. Just tell us what you want to understand, and we'll do the rest.
Choose Your Network(s)
Tell us which networks you want to monitor and we'll load the tool to collect the relevant data (does require public data sources, or for you to connect your private data sources).
Specify Insights
Tell us what insights you need, and we'll configure the tool, or nothing else is needed for 'out of the box' understanding on routes, fleet, blocks and on time running.
Start Using
We will give you logins via a browser and a service level to support how you intend to use iTTS.
Case Study: Public Transport in NSW
See how iTTS is helping people understand public transport in New South Wales, Australia, available via a public website.
Choose Routes of Interest
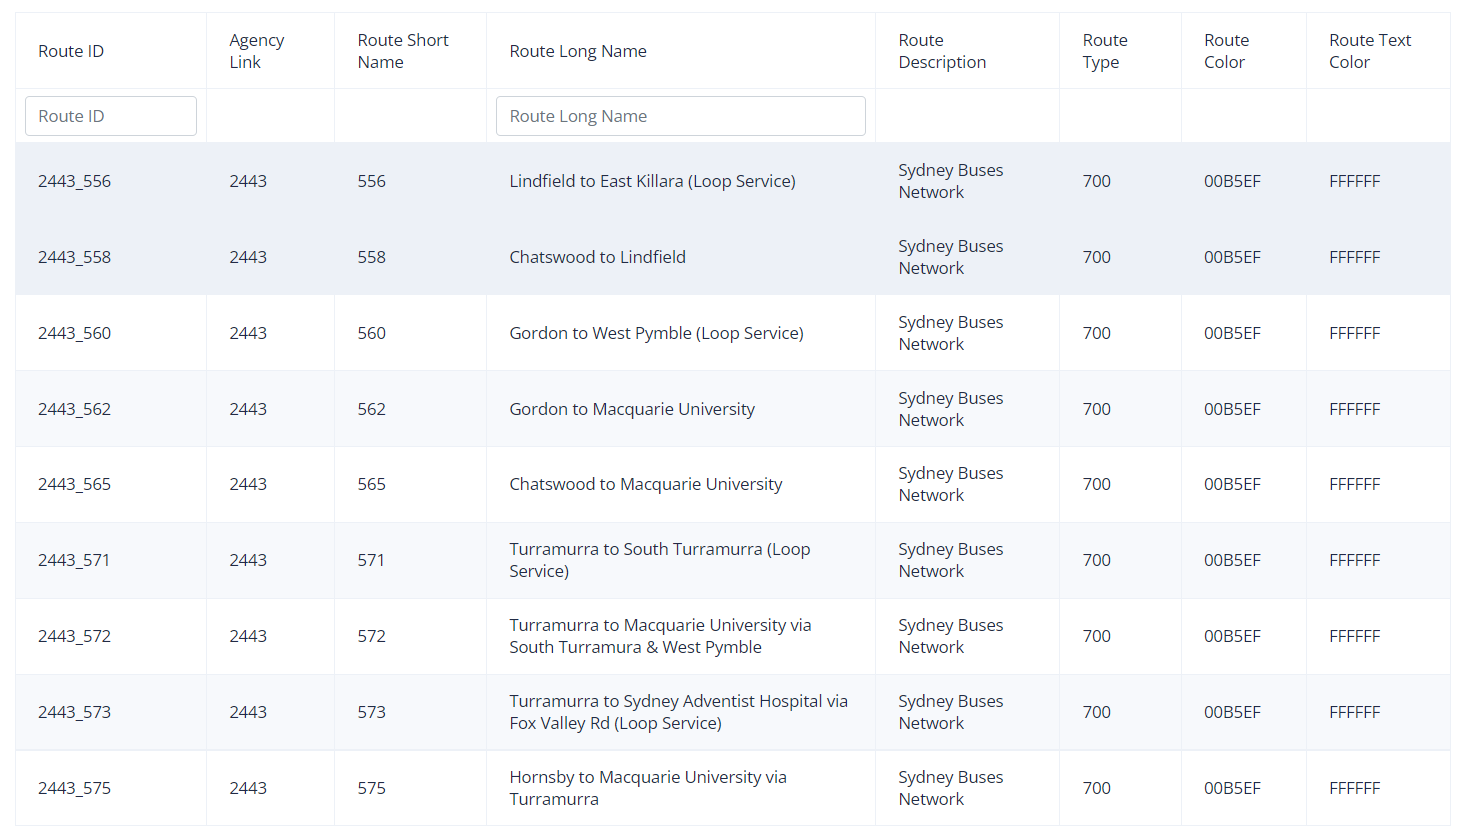
Filter down by route to see all possible routes in NSW. Choose the route(s) of interest for additional insights.
Explore The Route
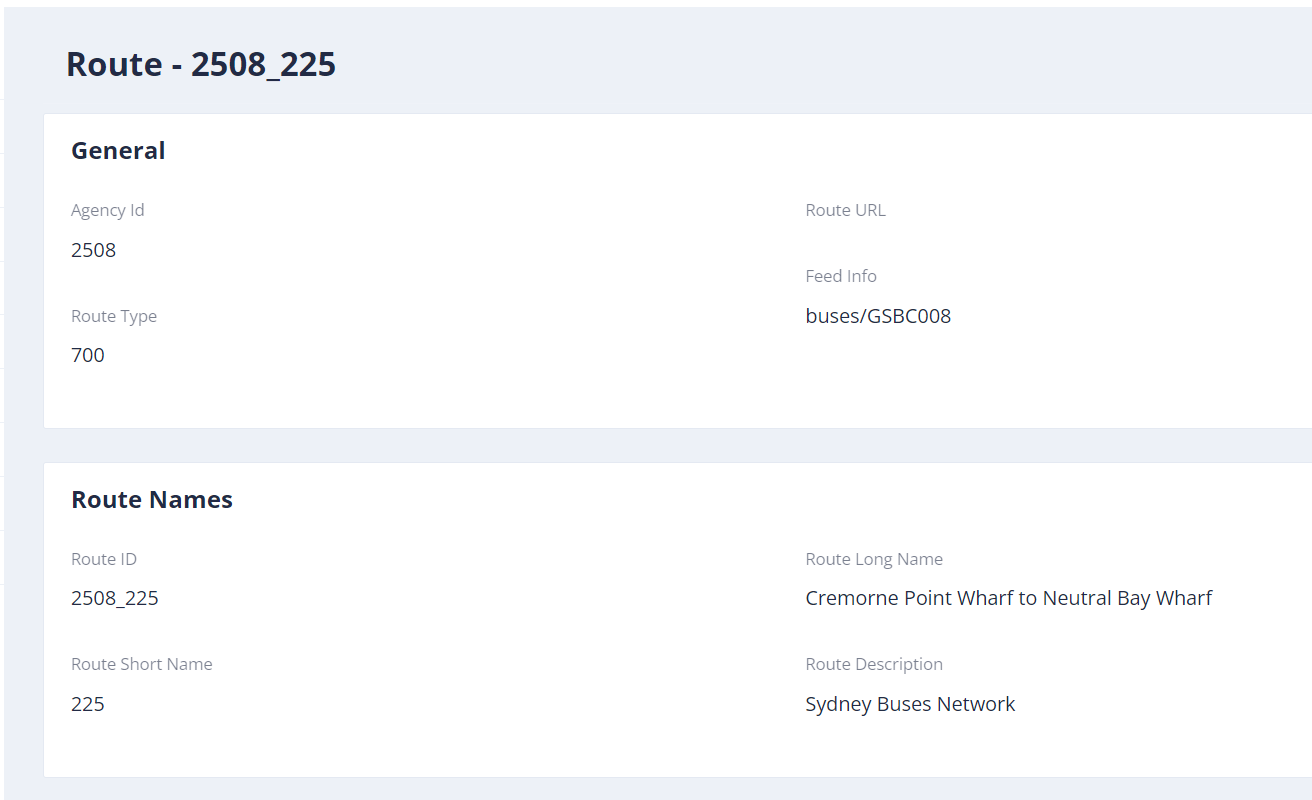
See the features of the route as a whole, or select relevant routes by stop, region, operator or mode.
Check Shape
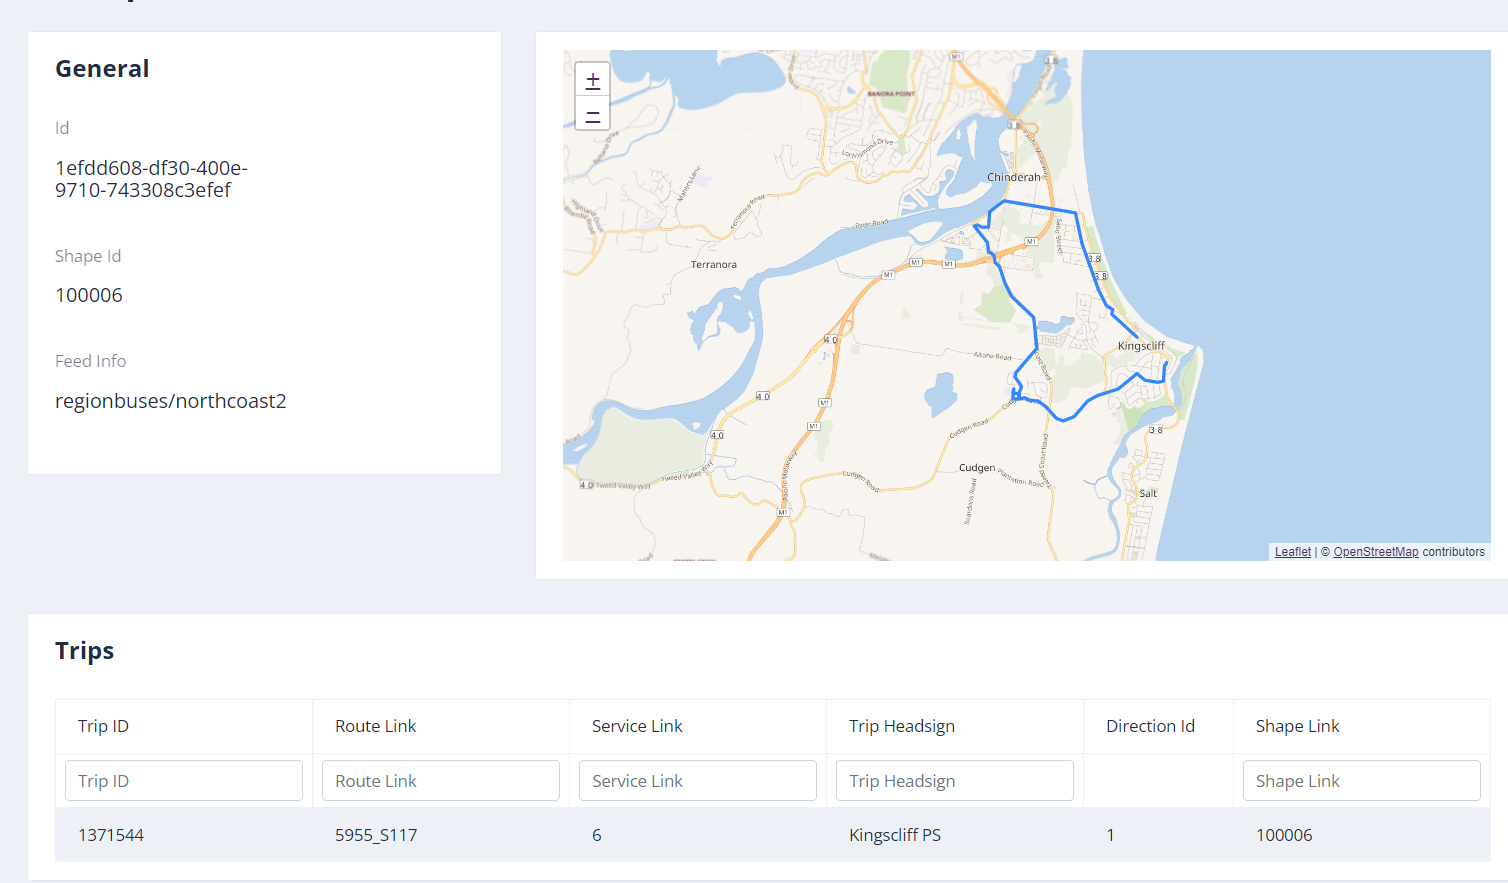
If you're the operator, you can view the shape file to check that the route follows the correct driving path, or a member of the public can see where routes go on a map.
Block Diagrams
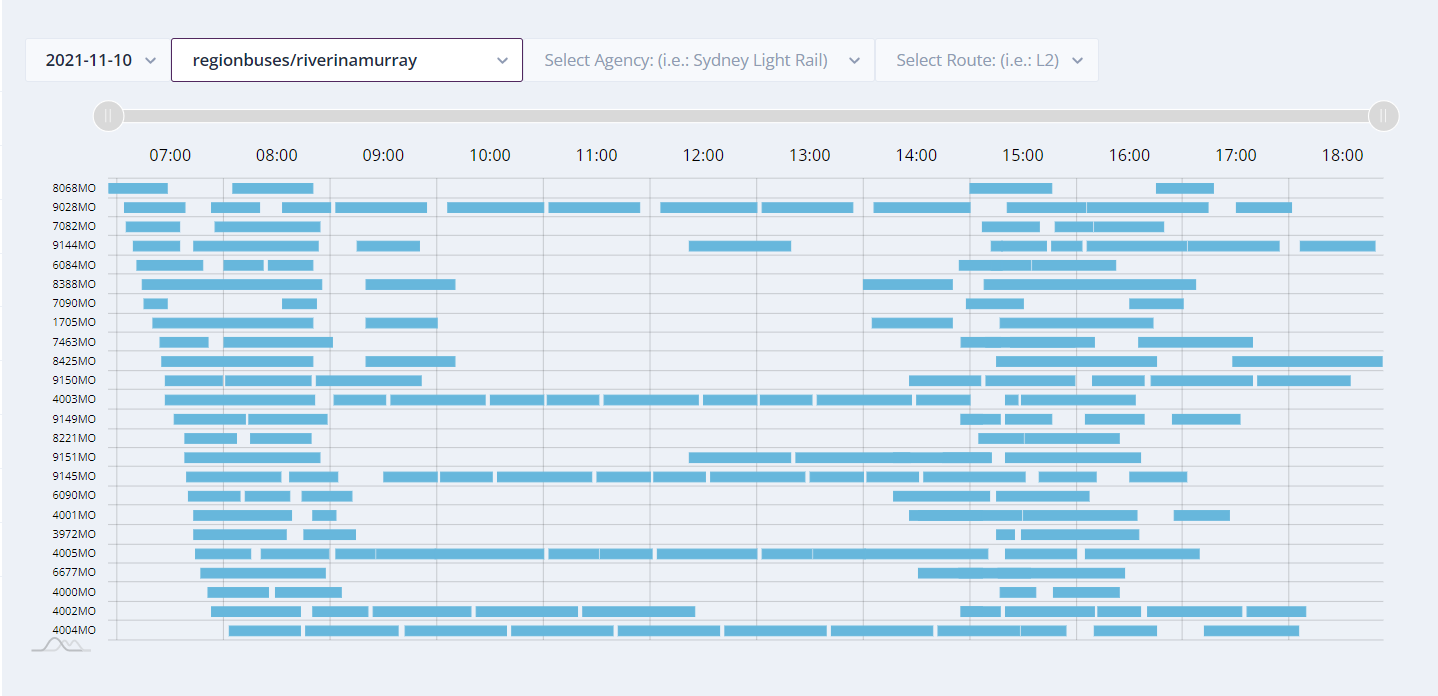
Choose a network and backwards-engineer the block diagrams. This will tell you how many vehicles run on the network and how well utilised they are.
On Time Running

Select individual routes to see on time running performance based on contractual KPIs.
Download Live Data
Prepare a download of historic GTFS-R data to see how many times in the last month your bus has been late.
Who We Are
Lynxx
Lynxx is a global analytics and optimisation company. We work with some of the world's most complex networks and systems. We often build analytics platforms or bespoke software tools to assist with optimisation or in this case insights relating to public transport networks.
iTTS
iTTS is part of our quest to democratise data. For this we took some of our tools for analysing live networks, combined them with some of our database products and produced a tool to allow people to generate their own insights.